
Cohort analysis and how to use python to beat the user retention game - Issue 1
Retention of your user base for your product is one of the ways to improve your revenue growth as returning customers most times require the least amount of marketing spends. Understanding your user base and knowing when would the right time to nudge them to reactivate gets quite essential and challenging and requires a product strategy. Most successful companies are inevitably the ones who understand their users very well and anticipate their needs much before. As a product manager and analyst, it is essential one unlock insights and segment the customers in order to serve them better. A data or a product analyst can help you evaluate the retention rates on various cohorts by analyzing the common characteristics that users share by deriving metrics such as reactivation rate, retention rate, average orders per customer (both basis count an dollar value) to name a few.
A cohort is a group of customers that usually share similar experiences in a defined period of time. Cohort analysis is a behavioral analytics tool which groups the customers into mutually exclusive cohorts measured over time. Using this analysis we are able to see trends around the product or the customer lifecycle.
Types of cohort:
The most common types of cohort analysis are time/acquisition cohort, behavioral cohort, size cohorts.
Acquisition cohort: Cohorts with customers who signed up for a product during a particular period of time
Behavioral cohort: Groups are divided basis their on their behaviors or actions. This will help you to understand your users in different demographics and with different behaviors.
Size based cohorts: Cohorts which refers to the various sizes of customers who purchase the product
Cohort analysis technique:
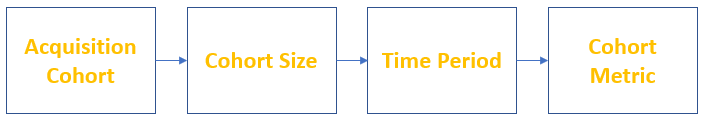
Before we jump into writing python code for figuring out the retention rate, let us understand the technique behind conducting a cohort analysis. First we need to identify the group of customers you want to analyze. For this article lets focus on the time/acquisition cohort which is the first time the user signed up for your product. Second measure the cohort size which refers to the time period for which the cohort analysis needs to be done for example a day, a week or a month. Thirdly define the time period for which the cohort analysis needs to be done. Finally we can generate the cohort analysis report for a specific metric, in our case, the retention rate.
Using python to perform cohort analysis to calculate the retention rate:
Let us conduct cohort analysis on customer retention metrics using an retail online dataset (source: https://archive.ics.uci.edu/ml/machine-learning-databases/00352/)
Step 1: Clean the data to get the acquisition month of each customer. First view the top few columns to understand the various attributes of the database
# View the top 5 rows of the online retail dataset
import pandas as pd
import datetime as dt
retail.head() 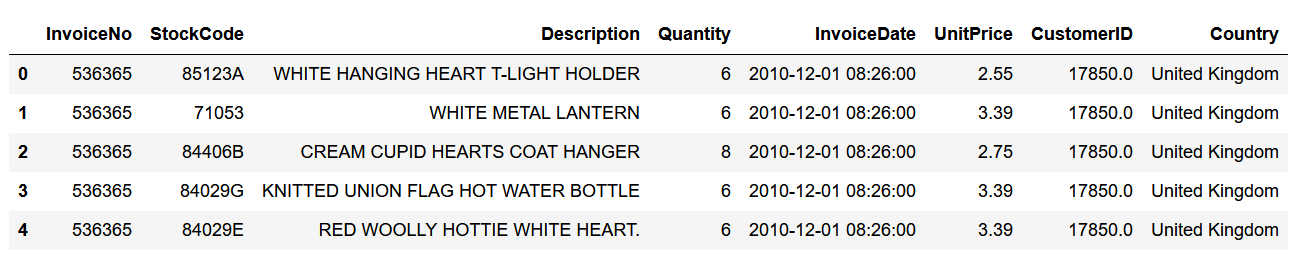
We have invoice no. , stock code, product description, quantity bought, invoice date, price per product, customer id and country in the retail dataset.
Now Let us assign the cohort Indices against each acquisition month by group the data by customer id.
# assign the acquisition month after grouping the data by customer id
def invoice_month(x):
  return dt.datetime(x.year, y.year, 1)

retail['InvoiceMonth'] = retail['InvoiceDate'].apply(get_month)
grouping = retail.groupby('CustomerID')['InvoiceMonth']
retail['CohortMonth'] = grouping.transform('min')
retail.head()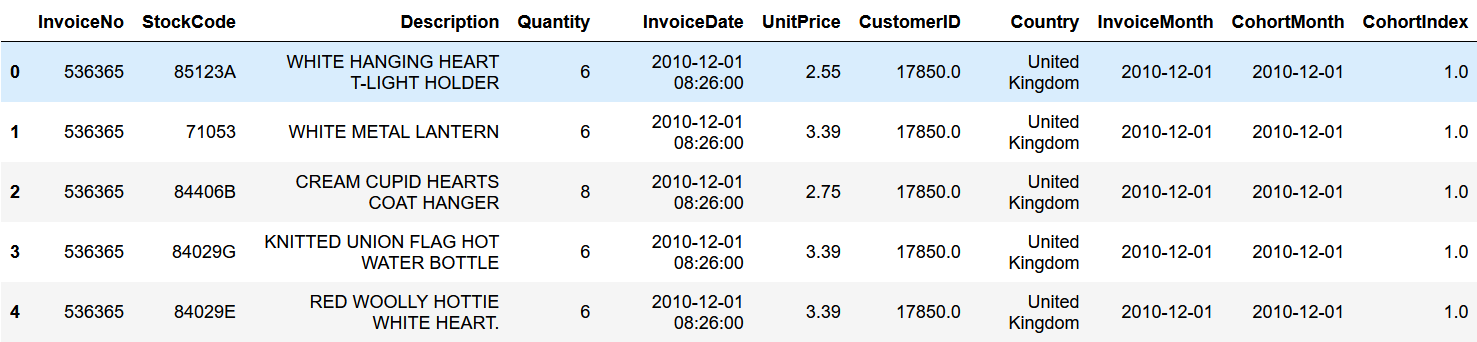
The cohort index 1 in the above snippet explains the first month of the cohort acquisition date.
Let us now count monthly active customers from each cohort
def invoice_date_int(df, column):
  year = df[column].dt.year
  month = df[column].dt.month
  day = df[column].dt.day
  return year, month, day

invoice_year,invoice_month,_=invoice_date_int(retail,'InvoiceMonth')
cohort_year,cohort_month,_=invoice_date_int(retail,'CohortMonth')
years_diff=invoice_year-cohort_year
months_diff=invoice_month-cohort_month
retail['CohortIndex']=years_diff*12+months_diff+1
retail.head()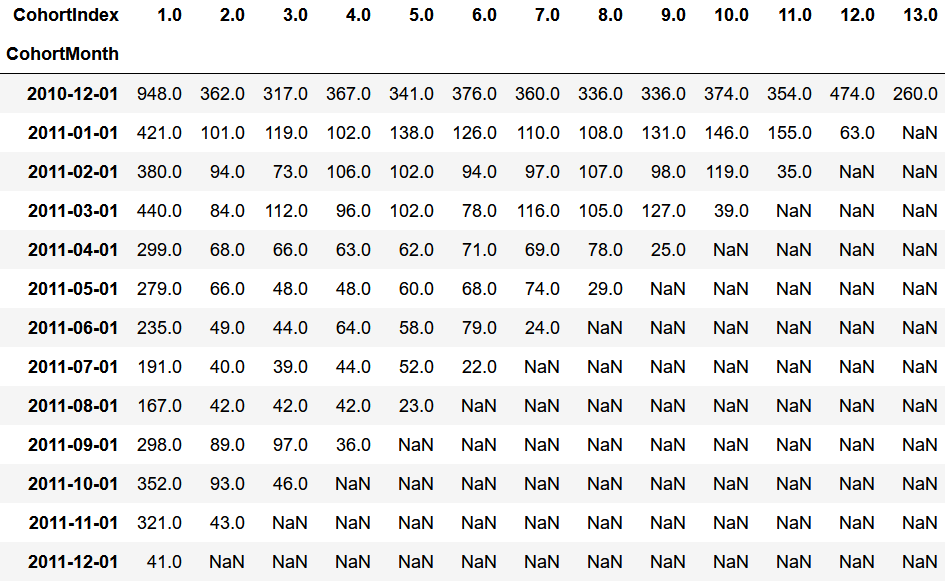
The column with cohort index 1 represents the customers originally signed up in each cohort. The remaining cohort indices represent the how many of those originally signed up customers were active in the following months.
Let us calculate the retention rates for each cohort. The below represents the retention rates of the cohorts in percentages.
cohort_sizes = cohort_counts.iloc[:,0]
retention = cohort_counts.divide(cohort_sizes, axis=0)
retention.round(3) * 100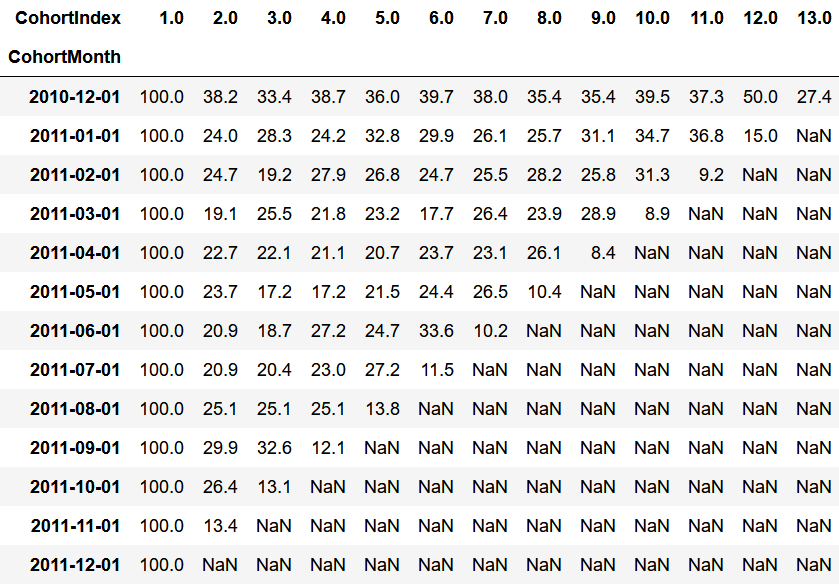
Though the above has retention rates per cohort per month, its still not that easy on our eyes. Easiest way to understand the above matrix is using a heatmap.
import seaborn as sns
import matplotlib.pyplot as plt
plt.figure(figsize=(10, 8))
plt.title('Retention rates')
sns.heatmap(data = retention,annot = True,fmt = '.0%',vmin = 0.0,vmax = 0.5,cmap = 'inferno')
plt.show()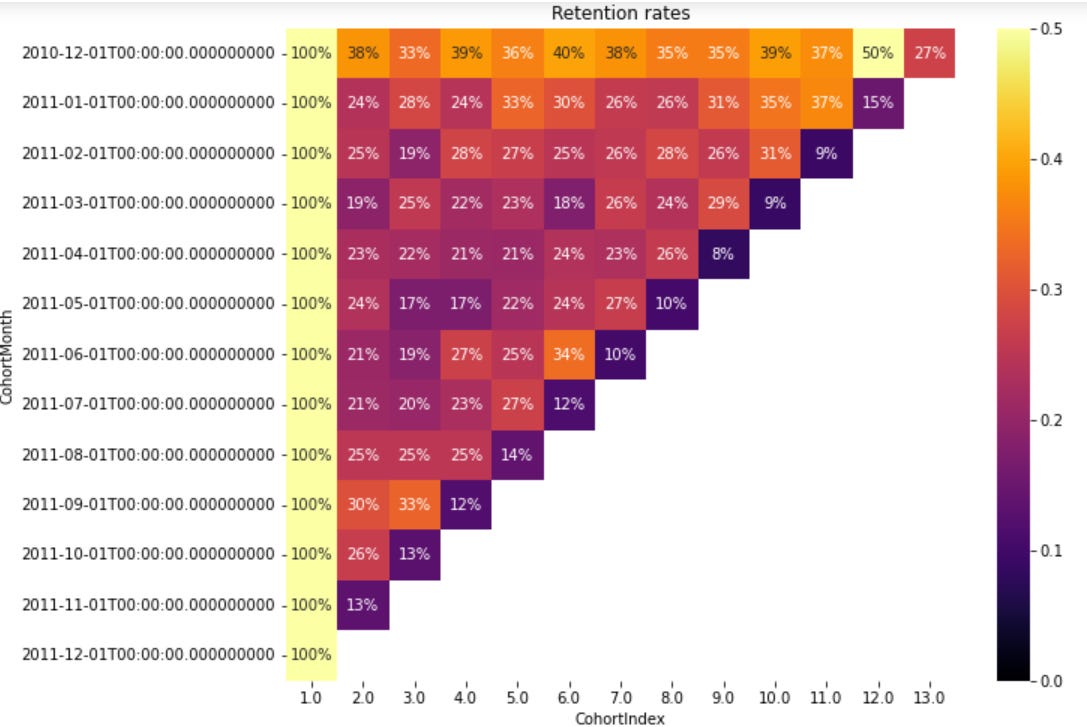
The above heat map implies for example in the cohort started in the month of May 2011, it had 17% of the customers return in the 4th month and 10% of the customers return in the 8th month. The blocks in orange represent a higher retention rate than the blocks in purple. The maximum retention has been been in the 12th month of the 1st cohort. One can study on the data points in that cohort and month to understand further on what those users bought and at what price and dates and make use of similar strategies to attract other users. The majority of the retention rates were coming in the first 2 cohorts from Dec 2010 and Jan 2011. From the above heatmap we can see that there is a drop in the retention rate in every cohort once they enter their 2nd and 3rd month (mean at 23% from 24%) and it picks up from the 4th month at an average 25% till their 9th month and then to 29% in their 10th, 11th, 12th months. So you can get the marketing team to send in nudges to activate the customers in those months to gt them back to the product.
In the above manner one can leverage the cohort analysis using python to maximize customer retention. Using insights as above we can plan reactivation emails, target offers, loyalty programs to attract the users.